It happens too often that Power BI reports show incorrect values or don’t work at all due to a missing date table. This article is intended to remedy this situation. Since the dimension “time” almost always plays a role in data analysis, the following can be used for practically every Power BI report.
Integrating a date table is one of the first steps in creating a clean data model in Power BI. But why is this “calendar” actually needed?
In Power BI there are so-called DAX time intelligence functions, which only work correctly if there is a table in the Power BI data set, in which each date is listed, for which values are available.
The best way to illustrate this is with an example.
To follow the below instructions directly in Power BI, the files used can be downloaded here:
①
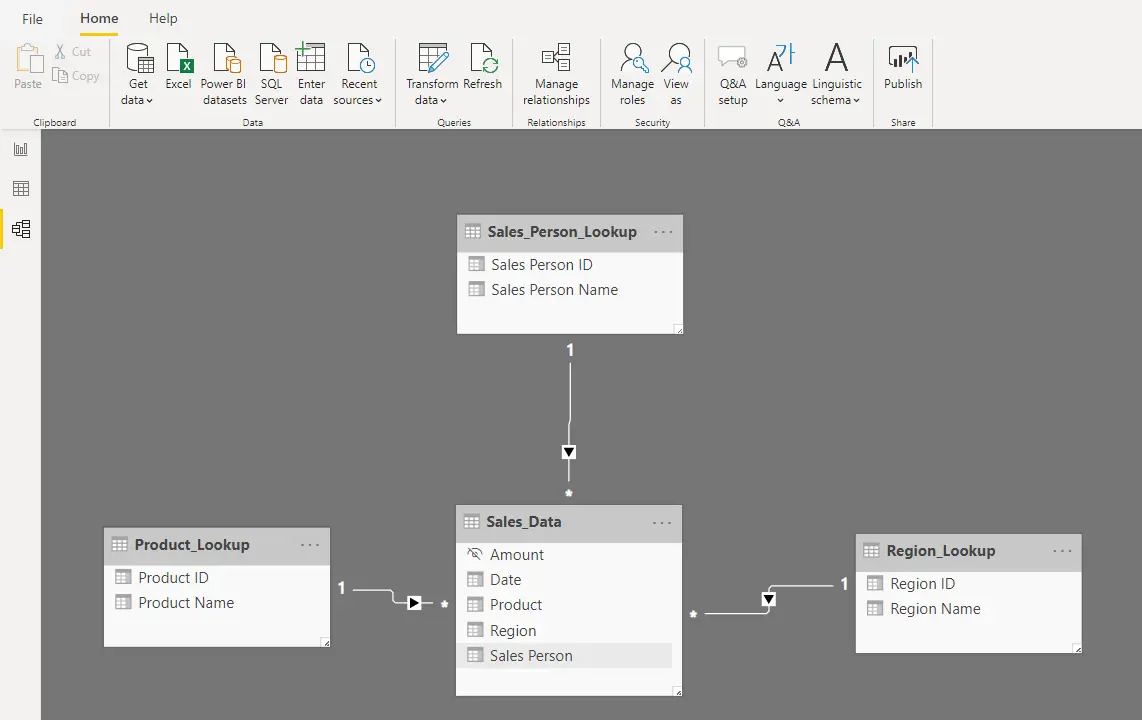
For our example, we load the following 4 tables from Excel:
- Product_Lookup: master data of the products
- Sales_Person_Lookup: master data of the seller
- Region_Lookup: master data of the sales regions
- Sales_Data: transaction data of all sales
These tables lead to the following data model.
②
Now we create the following 4 measures to illustrate the wrong way of doing it. All these measures contain the date dimension but since this can only be found in the sales table we are forced to take this date. We will create the correct measures later:
- Total of all sales: Sales = SUM(Sales_Data[Amount])
- Year to date sales: Sales YTD (wrong) = CALCULATE([Sales]; DATESYTD(Sales_Data[Date]))
- Sum of all sales of the previous year: Sales PY (wrong) = CALCULATE([Sales]; DATEADD(Sales_Data[Date];-1;YEAR))
- YTD sales of the previous year: Sales PY YTD (wrong) = CALCULATE([Sales PY (wrong)];DATESYTD(Sales_Data[Date]))
③
Next, we insert a table with our new measures.
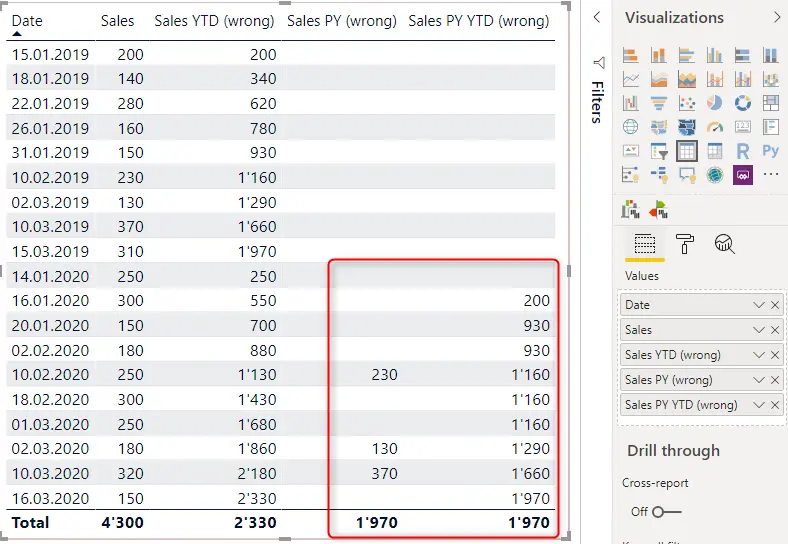
In the columns with the previous year’s values, it is clear that these measures are not working as desired. The reason for this is that we calculate previous year values exactly minus 1 year from the date in the table, but there is not a date in 2019 for every sale in 2020. Therefore, the sum of the 3 values from the “Sales PY (wrong)” column does not add up to the total.
④
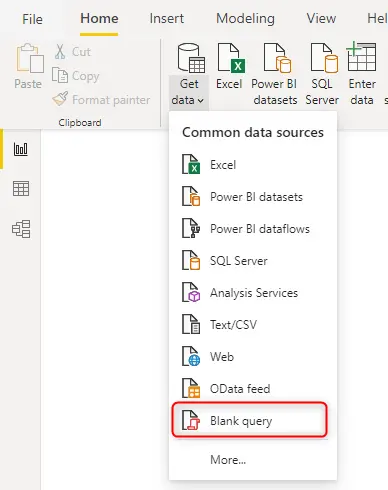
Let’s see the correct way of doing this with a date table. Date tables can be created in different ways. You can create and load a table in Excel, there is the DAX function CALENDARAUTO or you can use an M code in the Power Query Editor. In this case, we opted for the Power Query Editor option.
First, we add a new data source.
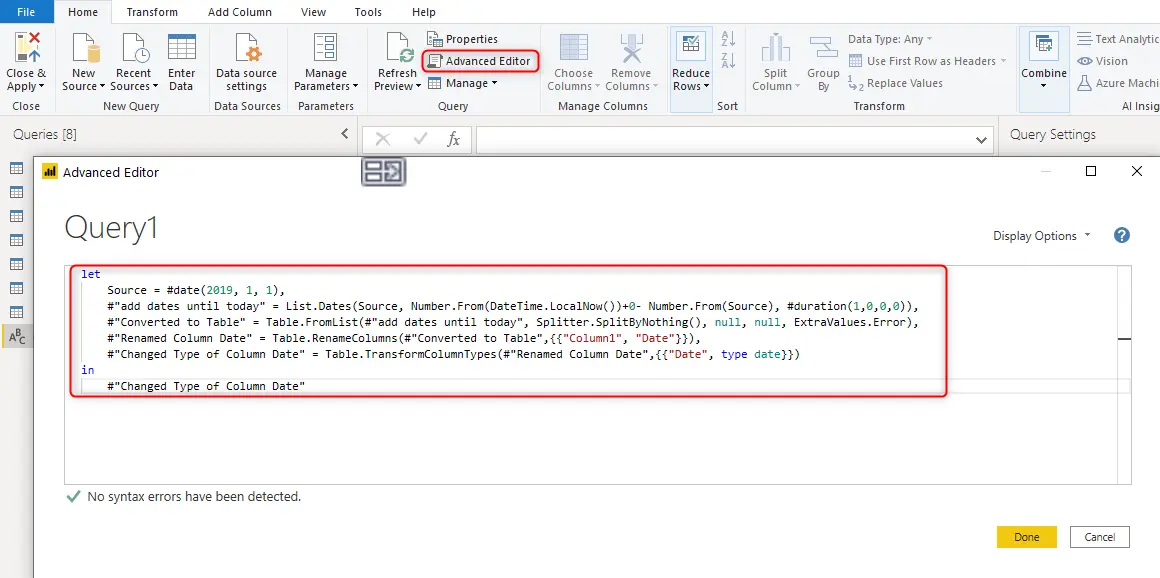
Next, we insert the M code for the calendar into the advanced Editor in Power Query Editor.
let
Source = #date(2019, 1, 1),
#”add dates until today” = List.Dates(Source, Number.From(DateTime.LocalNow())+0- Number.From(Source), #duration(1,0,0,0)),
#”Converted to Table” = Table.FromList(#”add dates until today”, Splitter.SplitByNothing(), null, null, ExtraValues.Error),
#”Renamed Column Date” = Table.RenameColumns(#”Converted to Table”,{{“Column1”, “Date”}}),
#”Changed Type of Column Date” = Table.TransformColumnTypes(#”Renamed Column Date”,{{“Date”, type date}})
in
#”Changed Type of Column Date”
This code creates a date table with the start date 01.01.2019 and the current date as the end date. The start date marked in red can be adjusted individually. If the calendar should also point to the future, the number marked in red can be adjusted accordingly. E.g. +365 leads to a calendar that ends one year from today.
Usually, additional columns are added to the date table. There are predefined functions in Power Query Editor to do this. As an example, let’s add a column which shows the year.
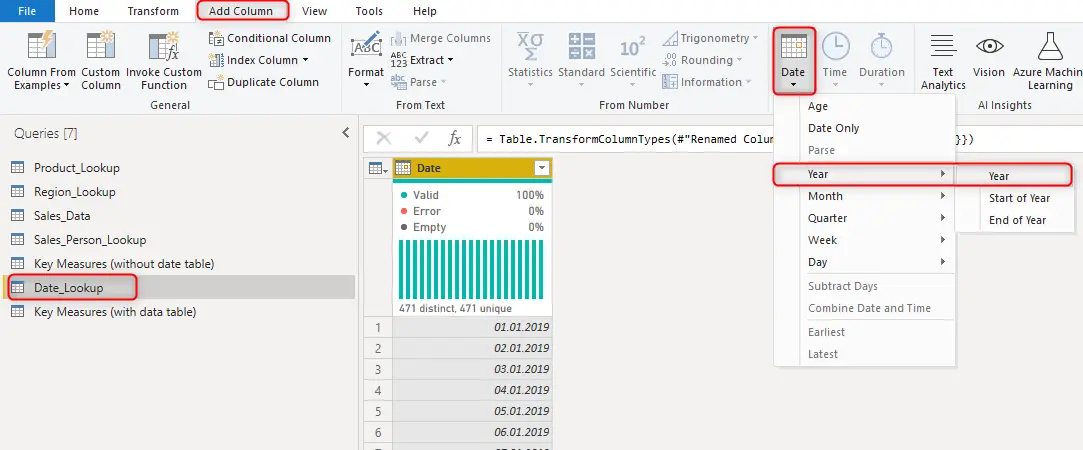
⑤
After this change, the new table must be loaded into Power BI Desktop and linked to the sales table.
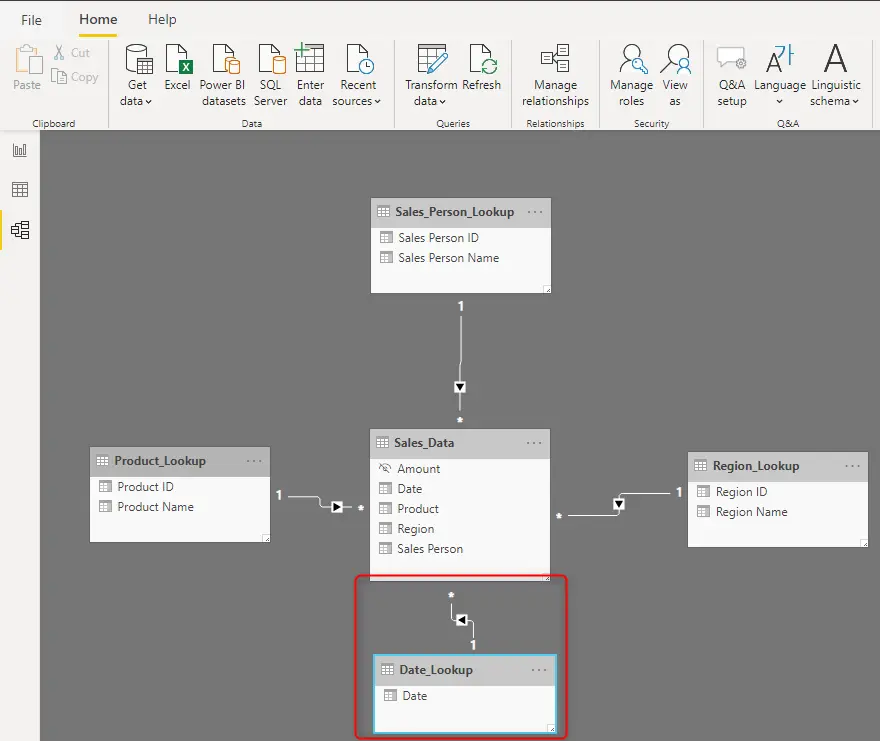
⑥
Now we create the same measures as described above, but this time we link to the date table:
- The already created Sales Measure does not contain a time intelligence function and therefore does not have to be created again
- Sales YTD (correct) = CALCULATE([Sales]; DATESYTD(Date_Lookup[Date])
- Sales PY (correct) = CALCULATE([Sales]; DATEADD(Date_Lookup[Date];-1;YEAR)
- Sales PY YTD (correct) = CALCULATE([Sales PY (correct)];DATESYTD(Date_Lookup[Date]))
⑦
We are now ready to compare the two results. To do this, we insert a table with the new measures. This time, however, we use the date from the date table.
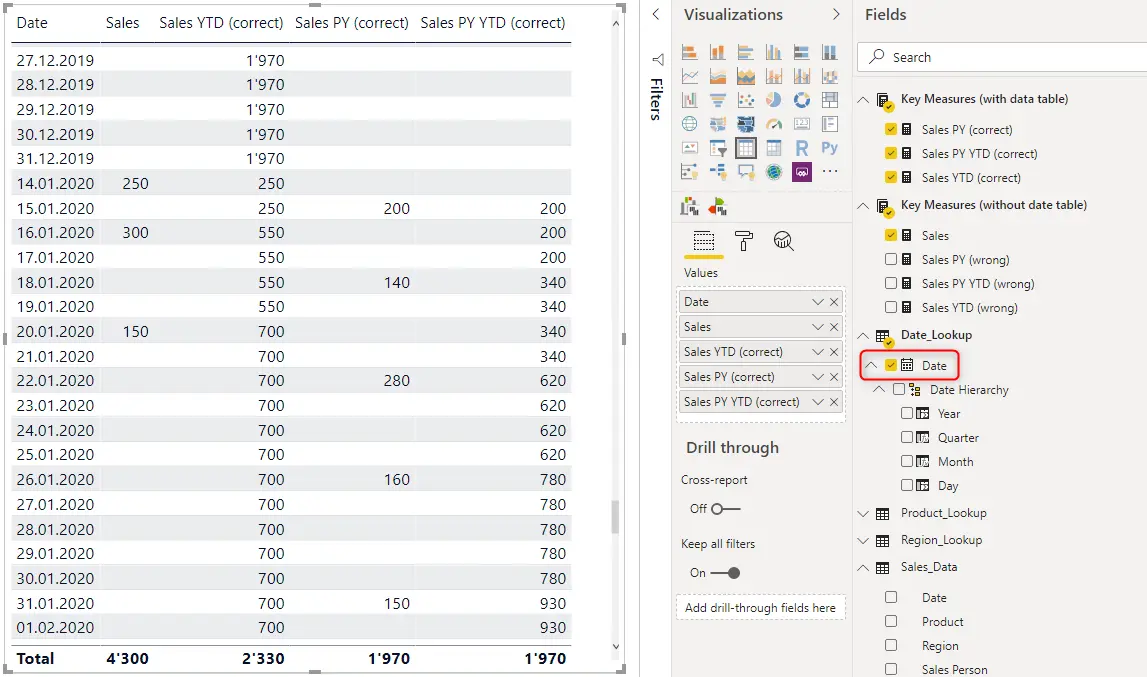
In this new table, you can see that every date is available and that every row shows correct values.
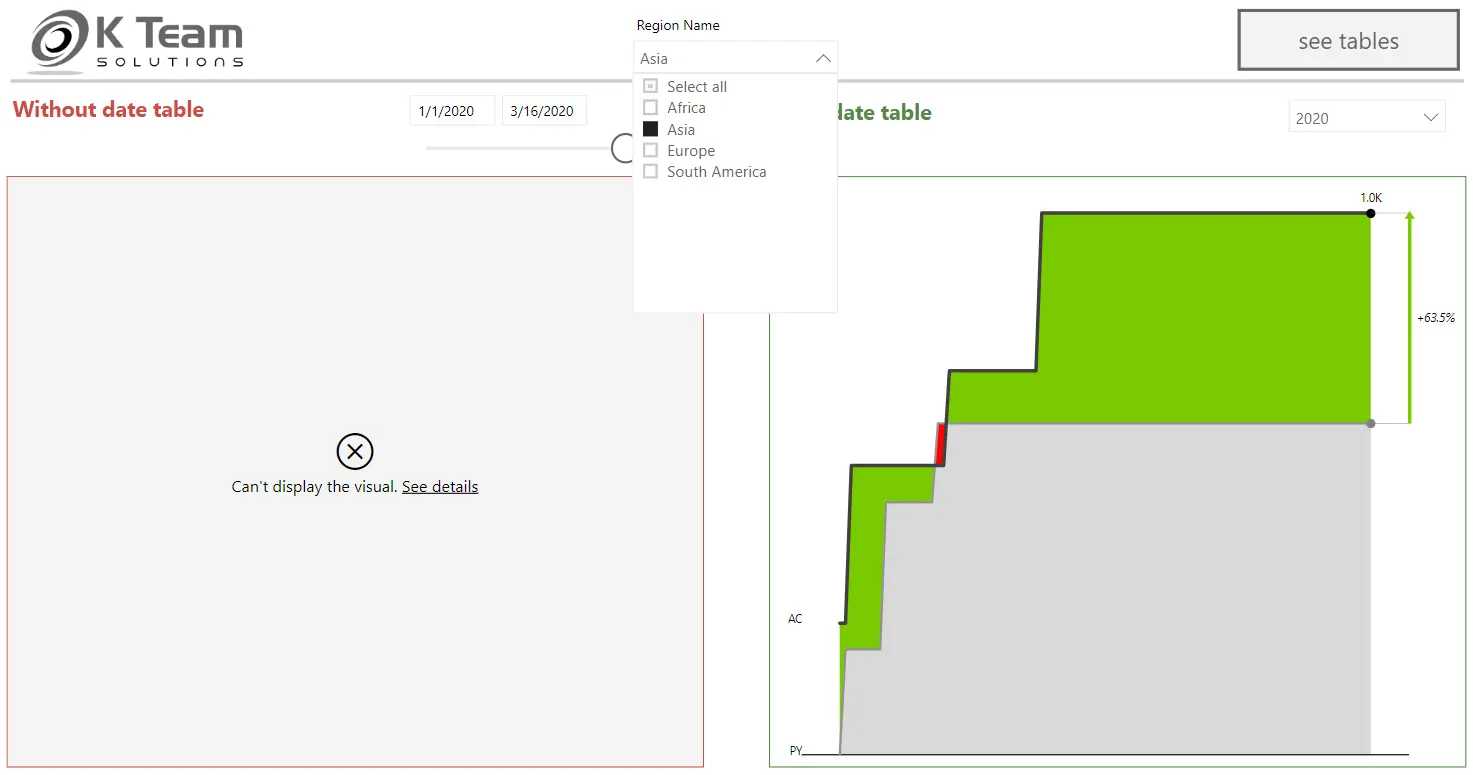
However, the whole thing becomes much clearer once the YTD sales figures for 2020 are compared with the previous year in a graph.
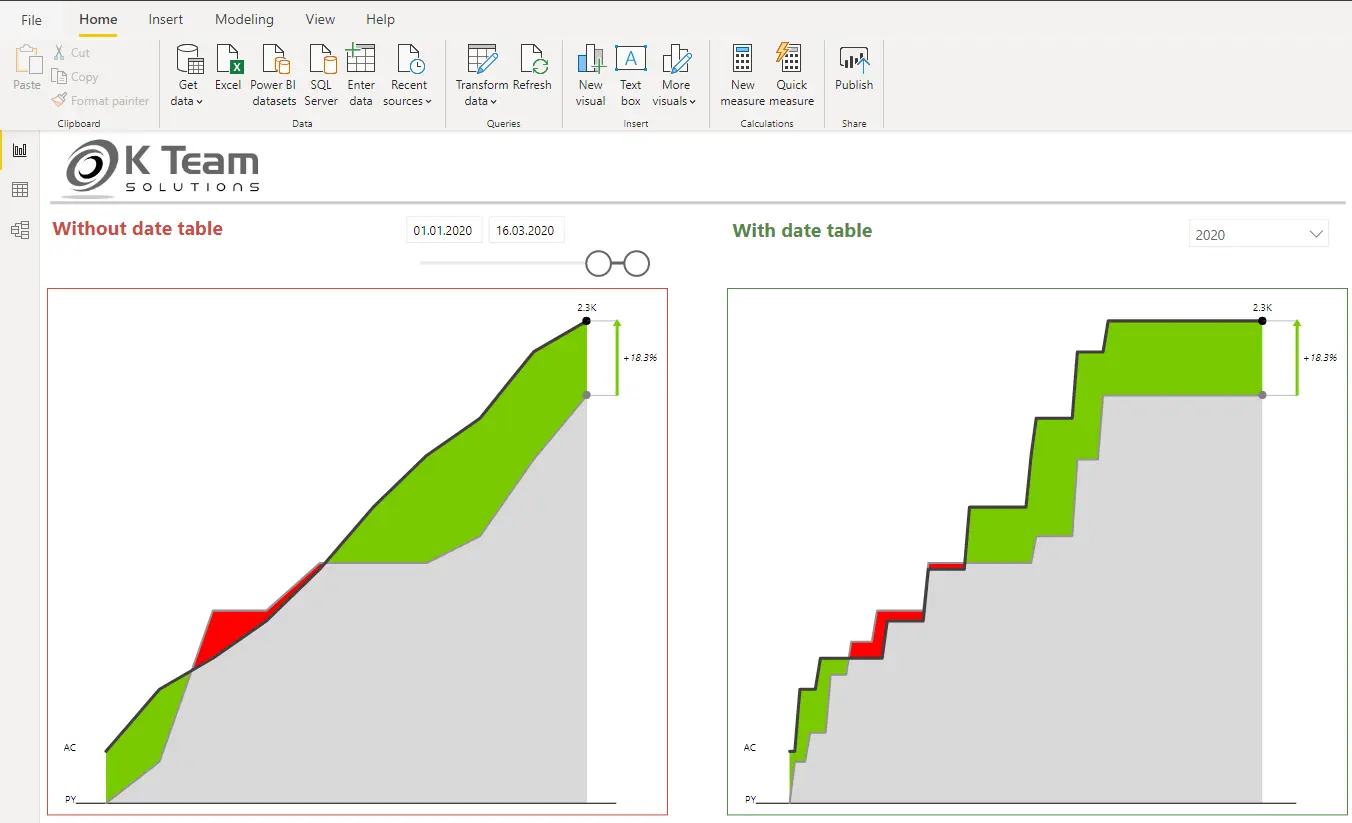
The left picture shows the development without the date table. Since only days are shown on which there was a sale, this view is not correct. On the right, however, there is one data point per day and the picture corresponds to the actual development.
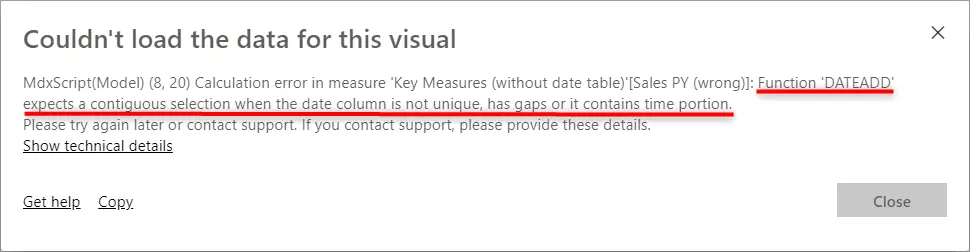
We now know that the data is not correct without a date table, but so far there has been no error message. Let’s see what happens when we filter by sales region. This time, Power BI can’t process our request for the visual which isn’t linked to the date table.
If we take a closer look at the error message, it becomes clear that we cannot get around a date table at anymore.
Can you now answer the question why you need a date table for your Power BI report? Get in touch and let us know